Reading what invalidates a setup
Conditions that supported a signal can weaken before a move develops. The Exit Signal marks one version of that. The rest is you watching the chart.
A signal appears when the framework's conditions are met. Markets then keep moving, and those conditions can stop holding before anything develops. A signal is a statement about the present — it is not a claim about what happens next.
The framework marks one form of this directly. An Exit Signal indicates that the conditions supporting a previously identified opportunity may no longer be present. What you do about that is your decision, as is everything else.
Between signals, the reading is yours. Below are the things worth watching.
Momentum weakening
Strong directional moves usually come with strong momentum behind them. When that fades, price can continue in the same direction for a while with less force behind it.
- Successively smaller advances during an uptrend
- Successively smaller declines during a downtrend
- Range expansion falling off
- Momentum measures flattening
See momentum indicators for what these measure and what they do not.
What that looks like
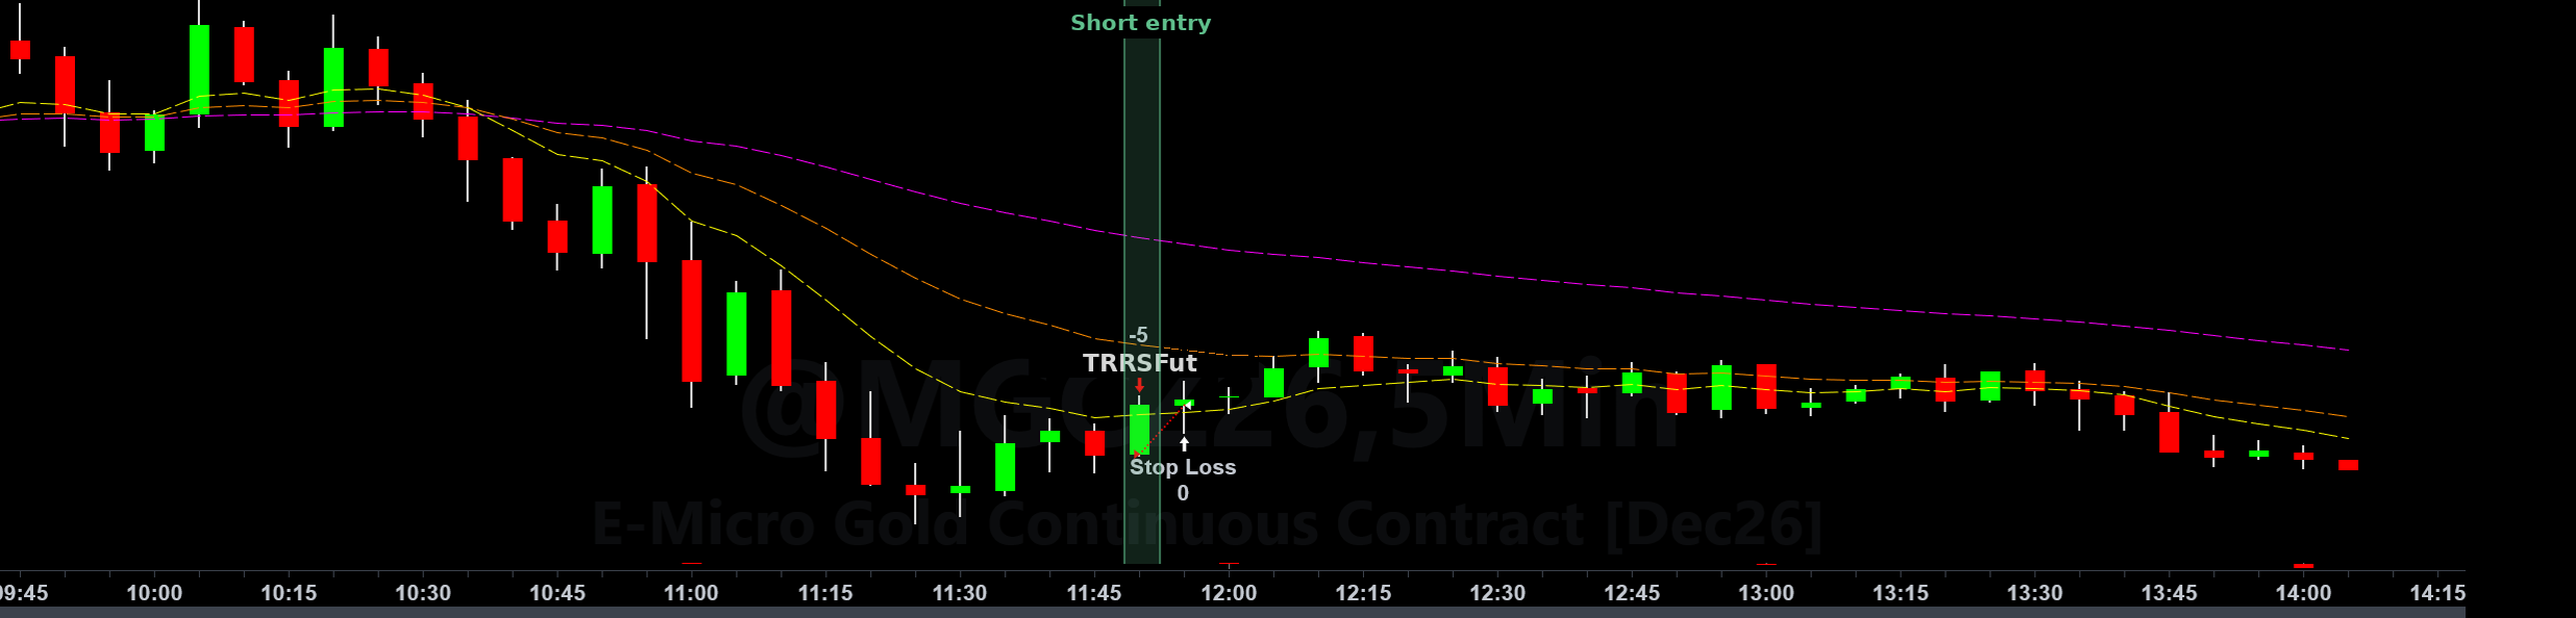
A short setup was marked on the 11:50 bar and the position opened at 4,414.00. The next bar traded through 4,419.40 and the stop closed it. Five and a half points, one bar.
The reason is in the measurements underneath.
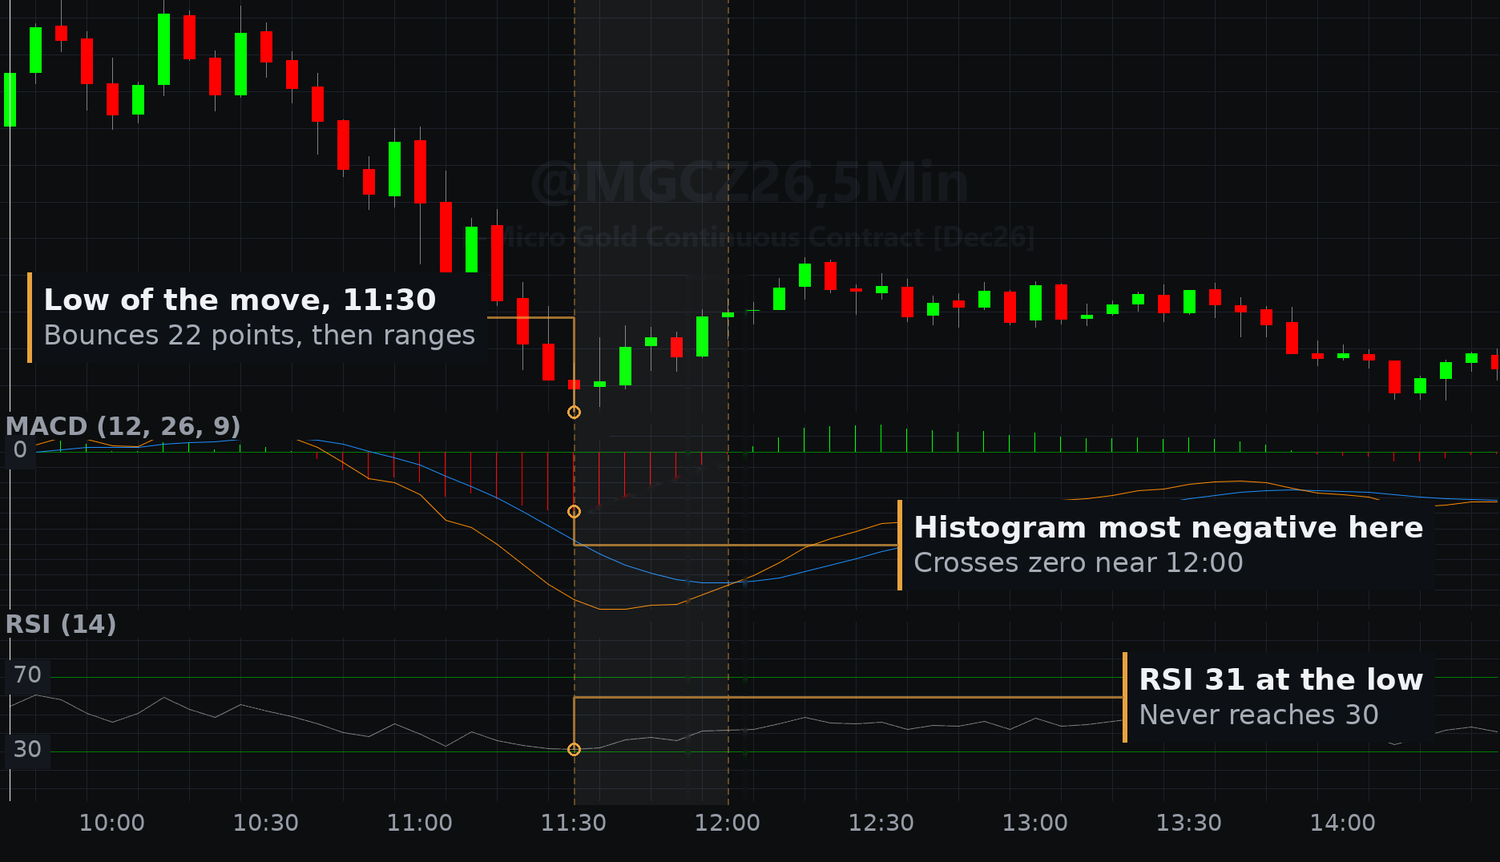
The decline runs from roughly 10:35 to 11:30. The bar that makes the low is also the bar where the MACD histogram is most negative. Maximum downside pressure and the end of the move arrive together, which is worth sitting with — the reading was at its strongest exactly where it stopped being useful.
From there the histogram contracts for six bars and crosses zero near 12:00. RSI reaches 31 at the low and turns up without touching 30.
Price bounces about 22 points into 12:15, ranges for roughly ninety minutes, then drifts back down and finishes the session near where it bottomed.
That last part is the useful bit. The weakening momentum indicated the decline had stopped. It did not indicate that anything else had started. A move ending and a new move beginning are separate events, and they are frequently separated by hours of nothing.
Which is where the short above sits. It was taken at 11:50, twenty minutes after the decline had already stopped, into the bounce rather than into a continuation. Every measurement describing that decline had been at its most extreme on the bar that ended it, and by 11:50 the histogram had been contracting for four bars. The stop was placed at a level that would only be reached if the read was wrong. It was reached on the next bar.
Divergence between price and momentum
Price making a new extreme while momentum does not is the standard reading that a move is losing strength.
Worth stating plainly: divergence does not signal a reversal. It can persist through an entire trend, printing repeatedly while price continues. It is worth noticing and weak on its own.
Structure failing to extend
Trends rarely turn without first showing wear. Failure to make new highs in an uptrend, failure to make new lows in a downtrend, increased consolidation after a strong move, repeated rejection at the same area, or a visible balance returning between buyers and sellers.
The clearest version arrives late by design: once a prior swing point has been taken out, the sequence that defined the trend is over. See naming a trend and pullbacks and reversals.
The environment changing underneath it
Markets alternate between trending and consolidating. A setup that developed in a trending environment may behave differently once conditions turn range-bound, and nothing about the setup itself will have changed. This is covered in regimes.
Scheduled events
The framework does not know what is on the calendar. Neither does any other chart-based tool — see what an indicator cannot see. Checking an economic calendar before you act is a step no software performs for you.
Releases that routinely move futures markets include FOMC decisions and minutes, employment reports, CPI and PPI, GDP, EIA crude inventories, and Treasury auctions. Technical conditions that looked settled minutes earlier can be overwhelmed by any of them.
Unscheduled news
Geopolitical developments, policy announcements, central bank commentary, corporate news. Price moves quickly as new information is priced, and no analytical framework anticipates events that have not happened.
Probabilities, not predictions
No signal, indicator, or framework predicts direction with certainty. Every setup is a probability. The aim is not to be right every time — it is to recognise when the conditions that supported a read have stopped holding, and to have decided in advance what that would look like.
Deciding it in advance is the part that matters. A level or condition chosen before you have a position does not move when the position does.