TRADESTATION INDICATOR SUITE

Market insight.
Real edge.

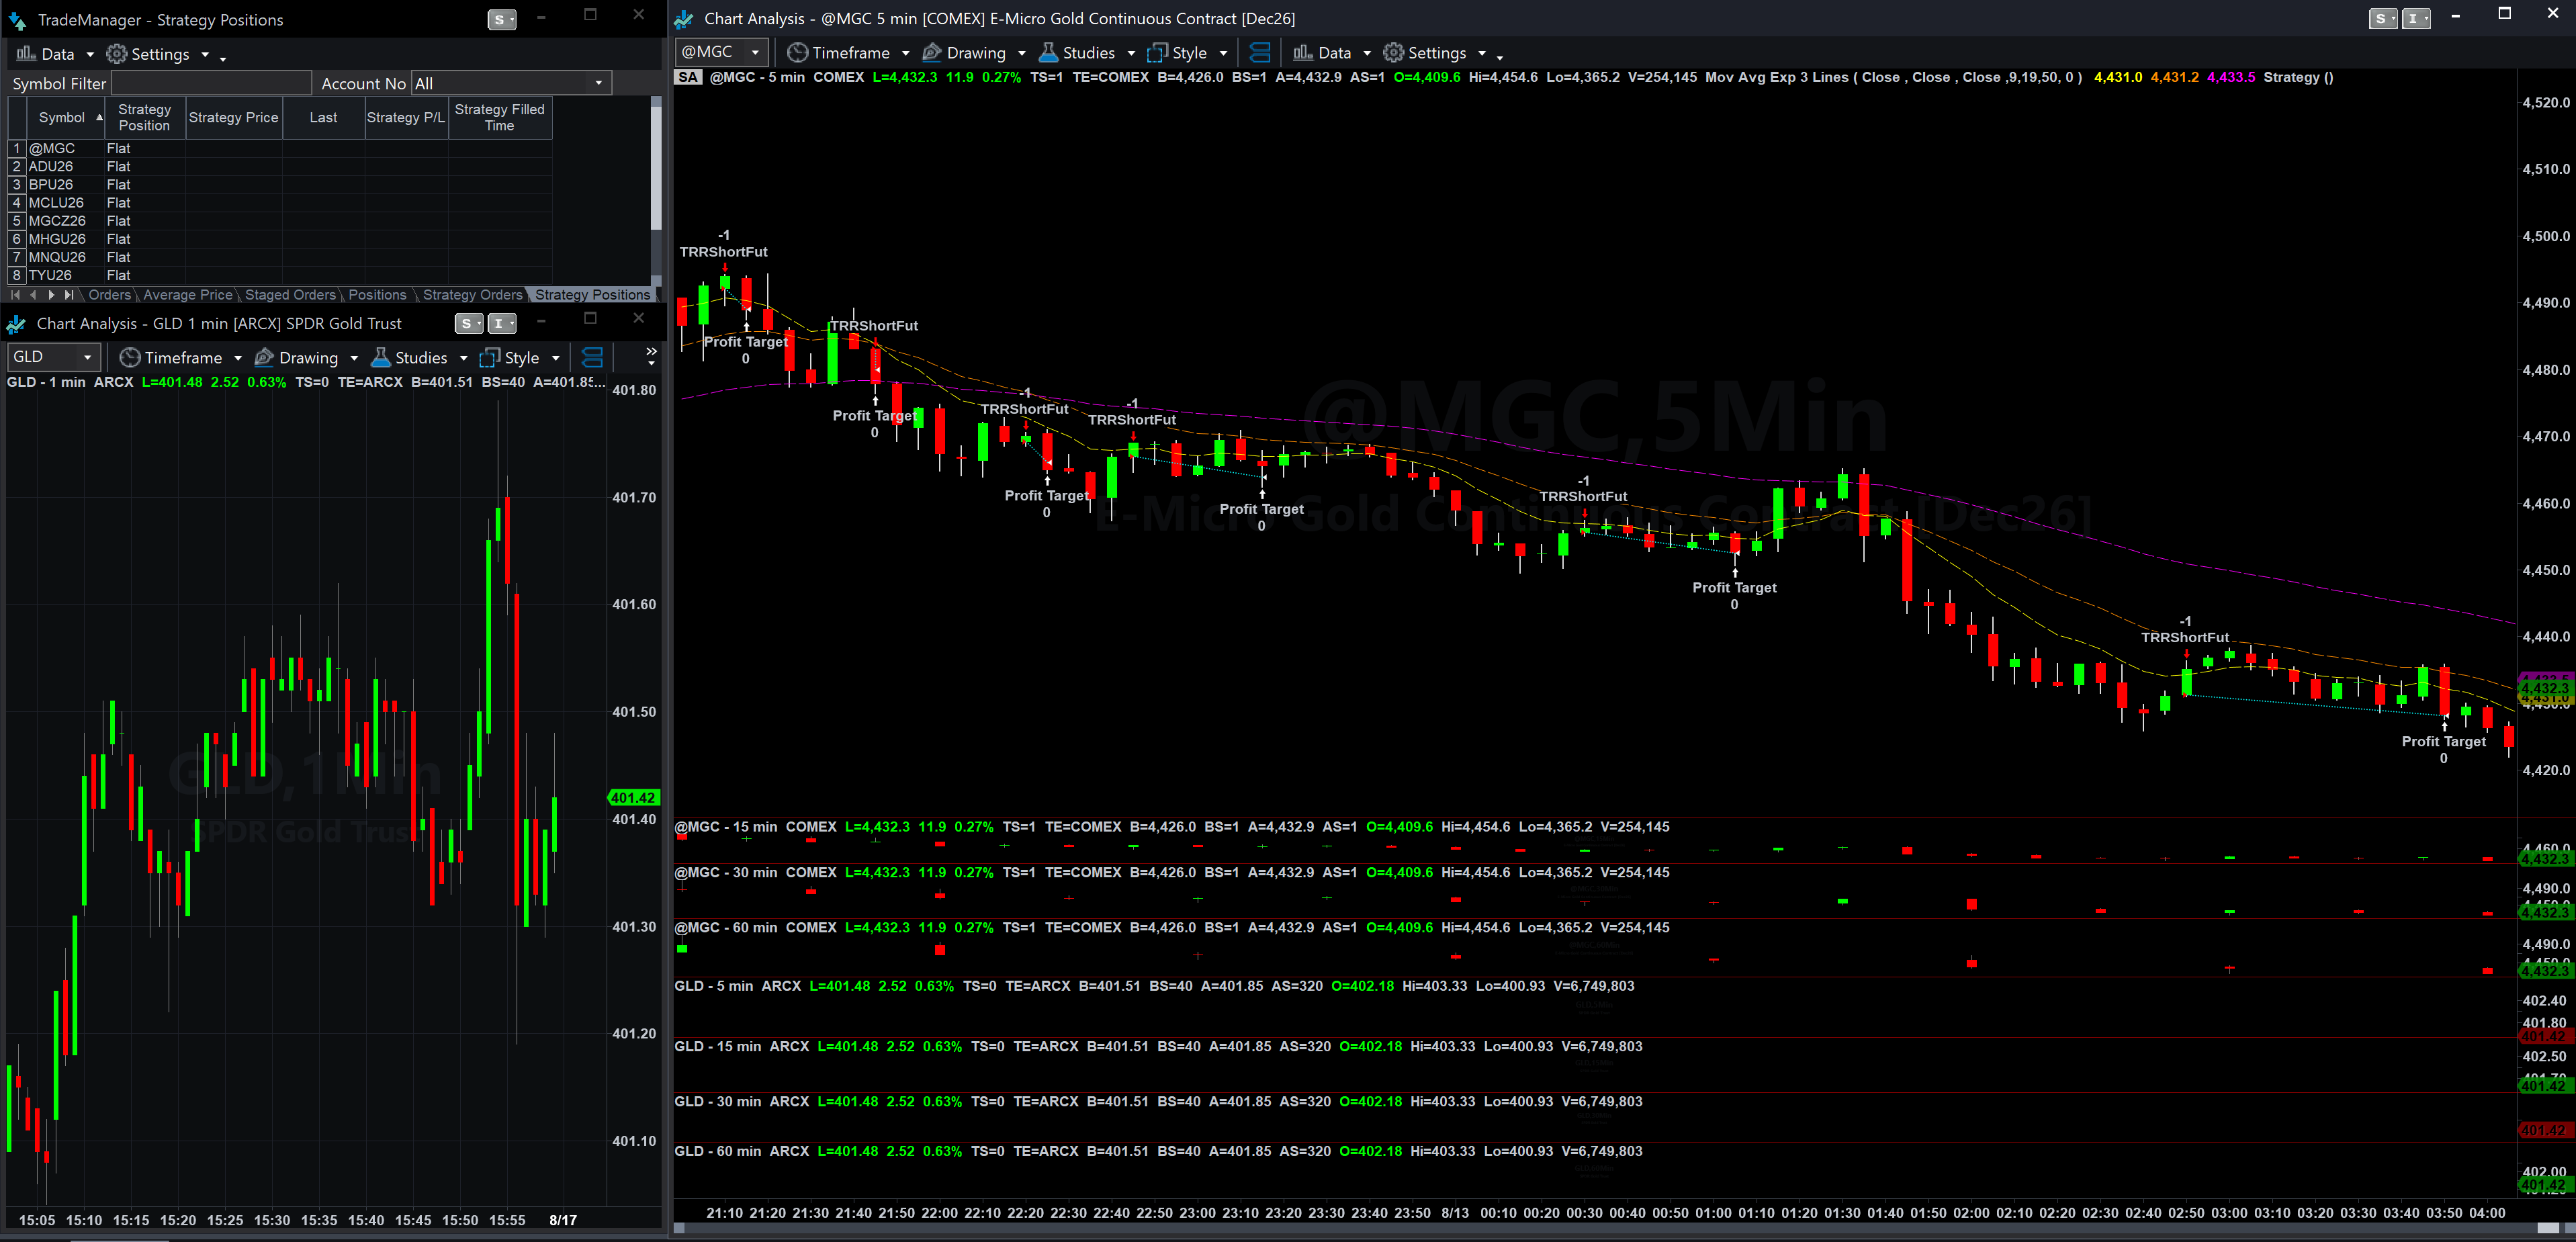
Recurring patterns, marked on your chart.

True Range Research is a technical indicator suite built for TradeStation. It reads historical price data to identify recurring patterns and marks the setups it finds on your chart — used alongside your own technical or fundamental analysis, not in place of it.

Futures and equities models, running natively on TradeStation.

TradeStation chart with True Range Research indicator overlays applied

Simulated account. Illustration only — not actual trading results, and not a representation of any outcome.

ABOUT

Built to make the chart legible.

True Range Research puts historical price data to work identifying recurring patterns on TradeStation, and marks the setups it finds directly on your chart. Models are available for both futures and equities.

Day trader, scalper, prop firm, or still learning to read a chart — the indicators measure the same thing either way.

Intraday Futures Traders

Built for the pace of decisions made in the time it takes a bar to close. Setups are drawn directly on the chart rather than buried in a separate panel, so there's nothing to reconstruct when one appears. The same framework holds whether you're taking a few positions a session or working shorter timeframes where extension and compression happen quickly.

Equities Traders

Equities get their own models, built for how stocks actually move. A name that ranges two percent on a normal day is a different animal from a futures contract, and the indicators are set up accordingly. Gaps, opening drives, and the long midday stretch where nothing happens all get treated as what they are. Setups appear on your chart the same way, tuned to the market you're trading.

Prop Firm Traders

Trading against a drawdown limit means consistency matters more than any individual trade. The suite gives you the same intraday framework on every chart, so entries and exits follow rules you can state out loud rather than instinct you can't repeat. What invalidates a setup is as visible as the setup itself.

Newer traders, and anyone without a desk background

You don't need to already know what an ATR band is. The indicators are built to make pullbacks legible — showing where a move has stretched relative to its own normal range, where price has found support before, and what would invalidate that read. Written guides on this site start with how a chart works and build from there, so you can learn what the measurements mean on your own time rather than being expected to know already. What you do with it is your call.

PRODUCT

What True Range Research does

A technical indicator suite that lives inside TradeStation, built around historical price analysis. Separate models for futures and equities.

Technical Indicators

A curated set of indicators built to work natively inside TradeStation's platform.

Futures and Equities

Separate models tuned to each market, rather than one set of settings forced onto both.

Custom Overlays

Overlays that layer on top of your existing charts for added context.

Historical Pattern Analysis

Analyzes historical price data to surface recurring patterns and possible setups.

TradeStation Integration

Designed to run directly on TradeStation, no separate software required.

Works With Your Own Analysis

Built to complement other technical and fundamental analysis, not replace it.

Clearly Labeled Setups

Setups are named and marked on the chart, so you can see what fired and where.

Twenty builds are available now — ten futures and ten equities, each tuned to one instrument and its paired ETF. See the full list. NinjaTrader and TradingView support are in development.

INSIGHTS

Learn the tools.

Written guides on technical indicators, range and volatility, and market structure. Each piece stands on its own — start wherever the gap is. No background assumed, and nothing that expires.

41 published • Browse all →

New pieces go up regularly. Leave your email and we'll tell you when they publish.

Written guides

Plain-language pieces on reading price data. Start anywhere.

Glossary

Every term used on this site and in the suite, defined once.

Screen walkthroughs

Unedited recordings of the suite loaded on a live chart.

Annotated charts

Marked-up examples showing what fired, and what invalidated it.

PRICING

Get access

One subscription. Two models, on the instruments you pick.

$199.99 / month
First 14 days free
  • ✓ Two models included — you choose the instruments
  • ✓ Two futures contracts, two equity tickers, or one of each — see the twenty builds
  • ✓ Add more builds any time — $79.99 / month or $799.90 / year each
  • ✓ Full indicator & overlay suite for TradeStation
  • ✓ Historical pattern analysis tools
  • ✓ Installation and platform setup support
  • ✓ Ongoing updates
You’ll need a TradeStation account. Which one depends on what you trade. Equity builds chart a stock alongside a matching ETF, so an equity account covers them. Futures builds chart a contract alongside a matching ETF, so those need a futures account and an equity account. A simulated account is enough to run the trial. Open a TradeStation account
Start 14 days free — monthly
$1,999.90 / year
Also 14 days free

The same suite, billed once a year instead of monthly. Twelve months at the monthly rate comes to $2,399.88, so the annual plan is $399.98 less — the equivalent of two months. Charged as a single payment when the 14 days end.

Start 14 days free — annual
Card required. Nothing is charged today. After 14 days, your subscription begins automatically and continues until you cancel. Monthly plans are charged $199.99 every month. Annual plans are charged $1,999.90 every twelve months. We'll email you three days before the first charge and three days before each renewal. Cancel anytime using the link in your receipt email, or by writing to support@truerangeresearch.com. Charges are not refunded or prorated; if you cancel, your access runs through the end of the period you've paid for.

UK and EU customers: you normally have 14 days to cancel a distance contract. Because access is supplied immediately, you'll be asked at checkout to consent to that and to acknowledge that you lose the 14-day cancellation right once access begins.

Futures and equities models are built separately, because a stock that ranges two percent on a normal day is a different animal from a futures contract. You pick which two instruments yours are tuned to.

Trade more than two? Additional builds are $79.99 per month or $799.90 per year each, added to the same subscription and renewing on the same date. See all twenty builds.

Fourteen days is around ten trading sessions. That's enough time to load the suite on the instruments you actually trade, see how the setups mark, and see it in more than one kind of market. Whether that read is useful to you is something you'll know by looking at your own charts, not from anything written on this page.

FAQ

Common questions

Do I need a TradeStation account?

Yes. True Range Research runs inside TradeStation on your own charts, and your license key is tied to your TradeStation customer number. It isn't a separate platform, and it doesn't connect to your broker or place orders. NinjaTrader and TradingView support are in development.

Which account depends on what you trade. Equity builds chart a stock alongside a matching ETF, so an equity account covers them. Futures builds chart a contract alongside a matching ETF, so those need a futures account and an equity account. Missing one side is why a chart loads half empty.

If you don't have an account, contact Peter Albino at TradeStation with questions about opening one, platform features, or TradeStation fees.

Phone: 312.803.3860 or 888.735.1222
Email: PAlbino@TradeStation.com

Open a TradeStation account

TradeStation is a separate company and does not provide, review, or endorse True Range Research. True Range Research receives no compensation for accounts opened through this link.

What is True Range Research?

It's a technical indicator suite for TradeStation. It reads historical price data to identify recurring patterns and marks the setups it finds directly on your chart. What you do with that is your decision.

What does it cost?

$199.99 per month, or $1,999.90 per year. Either way the first 14 days are free, and billing continues automatically until you cancel. The annual plan is $399.98 less than twelve monthly payments.

Do I need a card to start the 14 days?

Yes, but nothing is charged during the 14 days. After that the subscription begins automatically — $199.99 monthly or $1,999.90 annually, depending on which you picked — and renews until you cancel. We'll email you three days before the first charge.

Can I cancel?

Yes, anytime, from your billing account. Cancel during the first 14 days and you're never charged. Cancel later and your access runs through the end of the period you've already paid for.

Can I switch between monthly and annual?

Yes, but not automatically. Email support@truerangeresearch.com and we'll move you over at your next renewal.

Do you offer refunds?

No. The 14 days are there so you can decide before you pay anything. Once a period is charged it isn't refunded or prorated, and your access continues through the end of that period.

I'm in the UK or the EU. What about the 14-day cancellation right?

Consumers in the UK and EU normally have 14 days to cancel a distance contract for digital content. Because access to the suite is supplied immediately, checkout asks you to consent to supply starting right away and to acknowledge that you give up that 14-day right once it does. If you'd rather keep the cancellation right, wait until the 14 days have passed before requesting access.

What does “two models” mean?

Each model is tuned to one instrument. Your subscription includes two, and you choose which — two futures contracts, two equity tickers, or one of each. Futures and equities are built separately, so each one is set up for how that market actually moves.

What will the charge look like on my statement?

It appears as TRUE RANGE RESEARCH. True Range Research is a trade name of PJV Holdings LLC, so receipts and invoices may show the company name as well.

Is this financial advice?

No. True Range Research is an educational and analytical tool. It's meant to be used alongside your own technical or fundamental analysis, not as a substitute for it. We don't manage accounts and nothing here is tailored to your individual circumstances.

Who is this built for?

Active day traders, scalpers, prop firm traders, and self-directed retail traders who want a disciplined, data-driven addition to their own research process.

Do I need prior trading experience?

Not necessarily. The indicators name and label what they're marking, so you're not left decoding an unfamiliar overlay. Written guides on this site cover what the measurements mean, starting from how a chart works.

You'll still be forming your own read. The suite marks patterns — it doesn't decide anything for you. Experienced traders use it the same way; it's designed so someone without a technical analysis background can pick it up.

How do I reach you?

For questions about the product, pricing, or what's included, email peter@truerangeresearch.com.

If you're already a subscriber and need help with installation, licensing, or billing, email support@truerangeresearch.com and include your platform and the email address on your subscription.

CONTACT

Let's talk trading tools.

Whether you're trading your own account, running an intraday book, or adding a research layer to what you already do, we're happy to walk through what True Range Research does.

Platform: TradeStation

Support covers the software: installation, licensing, platform setup, and billing. We don't answer questions about specific trades, current market conditions, or how to position an account. True Range Research publishes technical analysis software; the decisions stay with you.